In this post, we examine the evolution of U.S. Treasury market liquidity over the past year, which has witnessed myriad economic and political developments. Liquidity worsened markedly one year ago as volatility increased following the announcement of higher-than-expected tariffs. Liquidity quickly improved when the tariff increases were partially rolled back and then remained fairly stable thereafter (through the end of our sample in February 2026), including after the recent Supreme Court decision striking down the emergency tariffs and the subsequent announcement of new tariffs.
Why Treasury Market Liquidity Matters
The U.S. Treasury market is the largest securities market in the world, with more than $30 trillion in marketable debt outstanding as of February 28. The market is used by the Treasury Department to finance the U.S. government, by the Federal Reserve to implement monetary policy, and by financial institutions to manage interest rate risk and value other securities. Liquidity is essential to all of these uses and is therefore followed closely by market participants and policymakers.
How We Measure Treasury Market Liquidity
We define market liquidity as the cost of quickly converting an asset into cash (or vice versa). As in our past Staff Report, we look at three liquidity measures, estimated using high-frequency data from the interdealer market: the bid-ask spread, order book depth, and price impact. The measures are calculated for the most recently auctioned (on-the-run) two-, five-, and ten-year notes over New York trading hours (defined as 7:30 a.m. to 5 p.m., Eastern time).
Volatility and News over the Past Year
Because volatility is tightly linked to Treasury market liquidity (see this LSE post, for example), we first assess price volatility around important news events since April 2025. Volatility reflects the uncertainty that often emanates from economic and political developments. We measure so-called realized volatility (volatility based on actual price variation) at a daily level for the same securities—and using the same data—employed for our liquidity measures.
The chart below shows that volatility rose sharply after the April 2, 2025 tariff announcement, peaking between April 7 and April 9. Treasury yields initially declined following the April 2 announcement (perhaps due to flight-to-safety behavior by investors), with the 10‑year yield declining from about 4.2 percent to as low as 3.9 percent on April 4 before closing the day at about 4.0 percent (see the slide deck accompanying this May speech by Roberto Perli, manager of the System Open Market Account).
Volatility Trended Down after April 2025 Spike
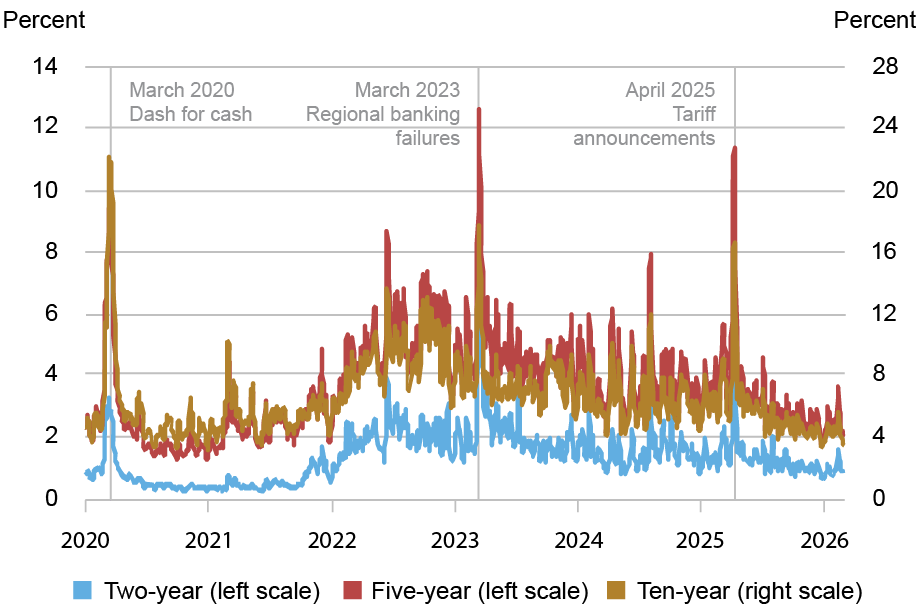
Notes: The chart plots five-day moving averages of price volatility for the on-the-run two-, five-, and ten-year notes in the interdealer market from January 2, 2020 to February 27, 2026. Price volatility is calculated for each day by summing squared one-minute returns (log changes in midpoint prices) from 7:30 a.m. to 5 p.m., annualizing by multiplying by 252, and then taking the square root. It is reported in percent. Drop lines flag the peaks in the five-day moving average for the ten-year note, which are centered around March 11, 2020, March 14, 2023, and April 8, 2025.
At the start of the next trading week, the ten-year yield opened lower than Friday’s close but rose rapidly, from about 3.9 percent to 4.5 percent, or roughly 60 basis points, between 8 p.m. on April 6 and midnight two days later. Some analyses suggest the unwinding of swap spread trades contributed to the rise in yields while others point to foreigners’ decreased willingness to hold Treasuries. On April 9, President Trump announced that most of the new country-specific tariffs were being postponed for 90 days. The ten-year yield declined sharply that day, later ending the week about 20 basis points higher than its level at the time of the April 2 announcement.
After April 9, volatility quickly declined to more normal levels and continued trending down in subsequent months as additional tariff-related news was announced: the implementation of the reciprocal tariffs, the Supreme Court decision striking down the tariffs, and the immediate imposition of new temporary tariffs. There was a blip up in volatility in February 2026 around the releases of the employment report (February 11) and consumer price index (February 13) but not around the Supreme Court decision (February 20). Note that our analysis ends with the last trading day of February 2026 and hence does not reflect effects from the conflict with Iran, which started the next day.
Market Liquidity over the Past Year
The bid-ask spread is the difference between the lowest ask price and highest bid price for a security, with a wider spread suggesting worse liquidity. Bid-ask spreads, shown in the chart below, widened markedly after the April 2 tariff announcement, albeit much less than in March 2020 and even somewhat less than during the March 2023 regional banking turmoil. Bid-ask spreads narrowed after the April 9 announcement that the new tariffs were mostly being postponed and since then have been similar to levels typically observed in recent years.
Bid-Ask Spreads Were Relatively Stable after April 2025 Widening
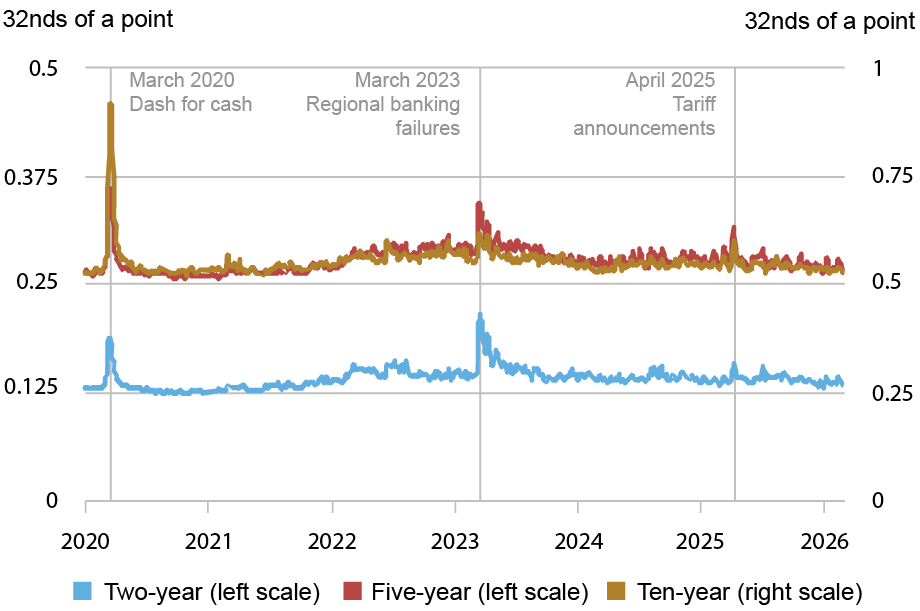
Notes: The chart plots five-day moving averages of average daily bid-ask spreads for the on-the-run two-, five-, and ten-year notes in the interdealer market from January 2, 2020 to February 27, 2026. Spreads are measured in 32nds of a point, where a point equals one percent of par. Drop lines flag the peaks in the five-day moving average for the ten-year note, which are centered around March 16, 2020, March 15, 2023, and April 9, 2025.
Order book depth is measured as the average quantity of securities posted for purchase or sale at the best bid and offer prices. Lower depth implies worse liquidity. This metric also points to relatively poor liquidity in April 2025, when available depth declined to the lowest levels since March 2023 (see chart below). Depth quickly recovered and by late summer 2025 was at levels similar to, if not better than, any time since the Fed’s post-COVID tightening cycle started in March 2022. Depth continued trending higher through February 2026.
Order Book Depth Increased Steadily after April 2025 Decline
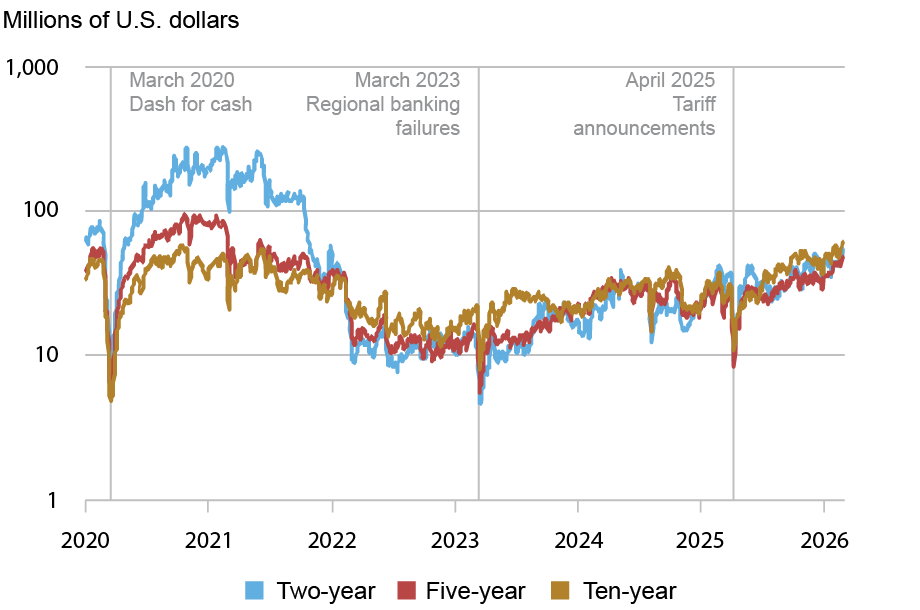
Notes: The chart plots five-day moving averages of average daily depth for the on-the-run two-, five-, and ten-year notes in the interdealer market from January 2, 2020 to February 27, 2026. Data are for order book depth at the inside tier, averaged across the bid and offer sides. Depth is measured in millions of U.S. dollars par and plotted on a logarithmic scale. Drop lines flag the low points in the five-day moving average for the ten-year note, which are centered around March 16, 2020, March 15, 2023, and April 9, 2025.
Measures of the price impact of trades also suggest a sharp deterioration of liquidity in April 2025, a quick rebound, and steady improvement thereafter. The next chart plots the estimated price impact per $100 million in net order flow (defined as buyer-initiated trading volume less seller-initiated trading volume). A higher price impact suggests reduced liquidity. Price impact rose abruptly on April 2, but then quickly reverted. By early 2026, price impact had become as low as at any time since 2021.
Price Impact Trended Down after April 2025 Increase
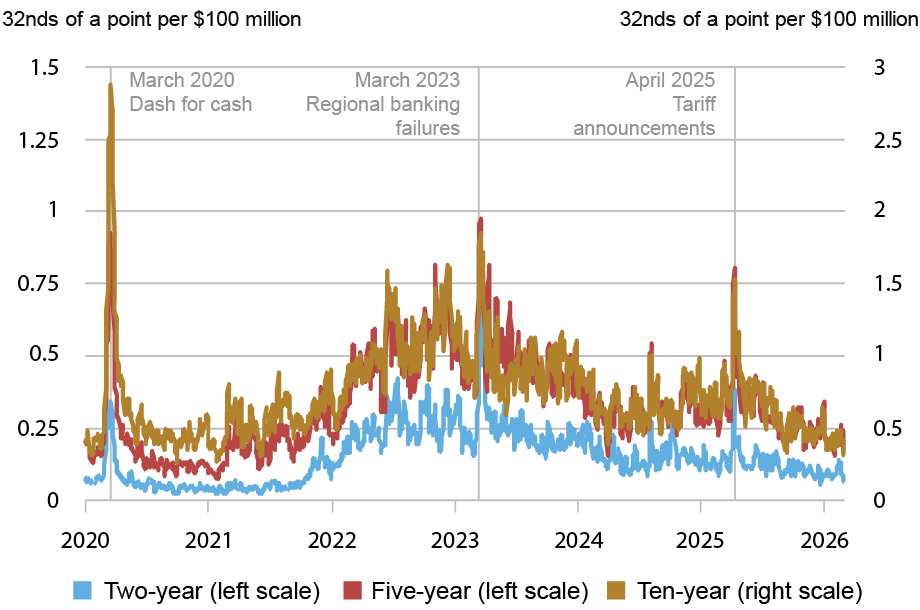
Notes: The chart plots five-day moving averages of slope coefficients from daily regressions of one-minute price changes on one-minute net order flow (buyer-initiated trading volume less seller-initiated trading volume) for the on-the-run two-, five-, and ten-year notes in the interdealer market from January 2, 2020 to February 27, 2026. Price impact is measured in 32nds of a point per $100 million, where a point equals one percent of par. Drop lines flag the peaks in the five-day moving average for the ten-year note, which are centered around March 17, 2020, March 16, 2023, and April 9, 2025.
Summing Up
Treasury market liquidity over the past year was marked by a sudden but brief worsening after the April 2, 2025 tariff announcement, followed by quick improvement when the proposed tariffs were partially rolled back. Liquidity steadily improved thereafter, reaching its best level since 2021 in early 2026. Economic uncertainty and interest rate volatility have increased since the end of our sample period—given the conflict with Iran and its repercussions—underlining the view that Treasury market liquidity warrants continued close watching.

Henry Dyer is a research analyst in the Federal Reserve Bank of New York’s Research and Statistics Group.

Michael J. Fleming is head of Capital Markets in the Federal Reserve Bank of New York’s Research and Statistics Group.
How to cite this post:
Henry Dyer and Michael J. Fleming, “Treasury Market Liquidity Since April 2025,” Federal Reserve Bank of New York Liberty Street Economics, April 2, 2026, https://doi.org/10.59576/lse.20260402
BibTeX: View |
Disclaimer
The views expressed in this post are those of the author(s) and do not necessarily reflect the position of the Federal Reserve Bank of New York or the Federal Reserve System. Any errors or omissions are the responsibility of the author(s).